Business reporting context
Define what a team needs to understand about its work. Tie report content to the records and activities that give it meaning.

Operate
Give teams a clear overview of active work and items requiring attention. Connect measures, charts and record lists to the business definitions and user responsibilities that make them meaningful.
Inside the product
Explore actual captured Inflow views. Change the view, open the original and read the context beside it.
Read the time spent in each state of the same completed case. Relate the time breakdown to the route the case actually followed.
Native Time panel for CLM-00006. Synthetic, minute-scale demonstration timings; no measured improvement claim.
Explore this capabilityDefine what a team needs to understand about its work. Tie report content to the records and activities that give it meaning.
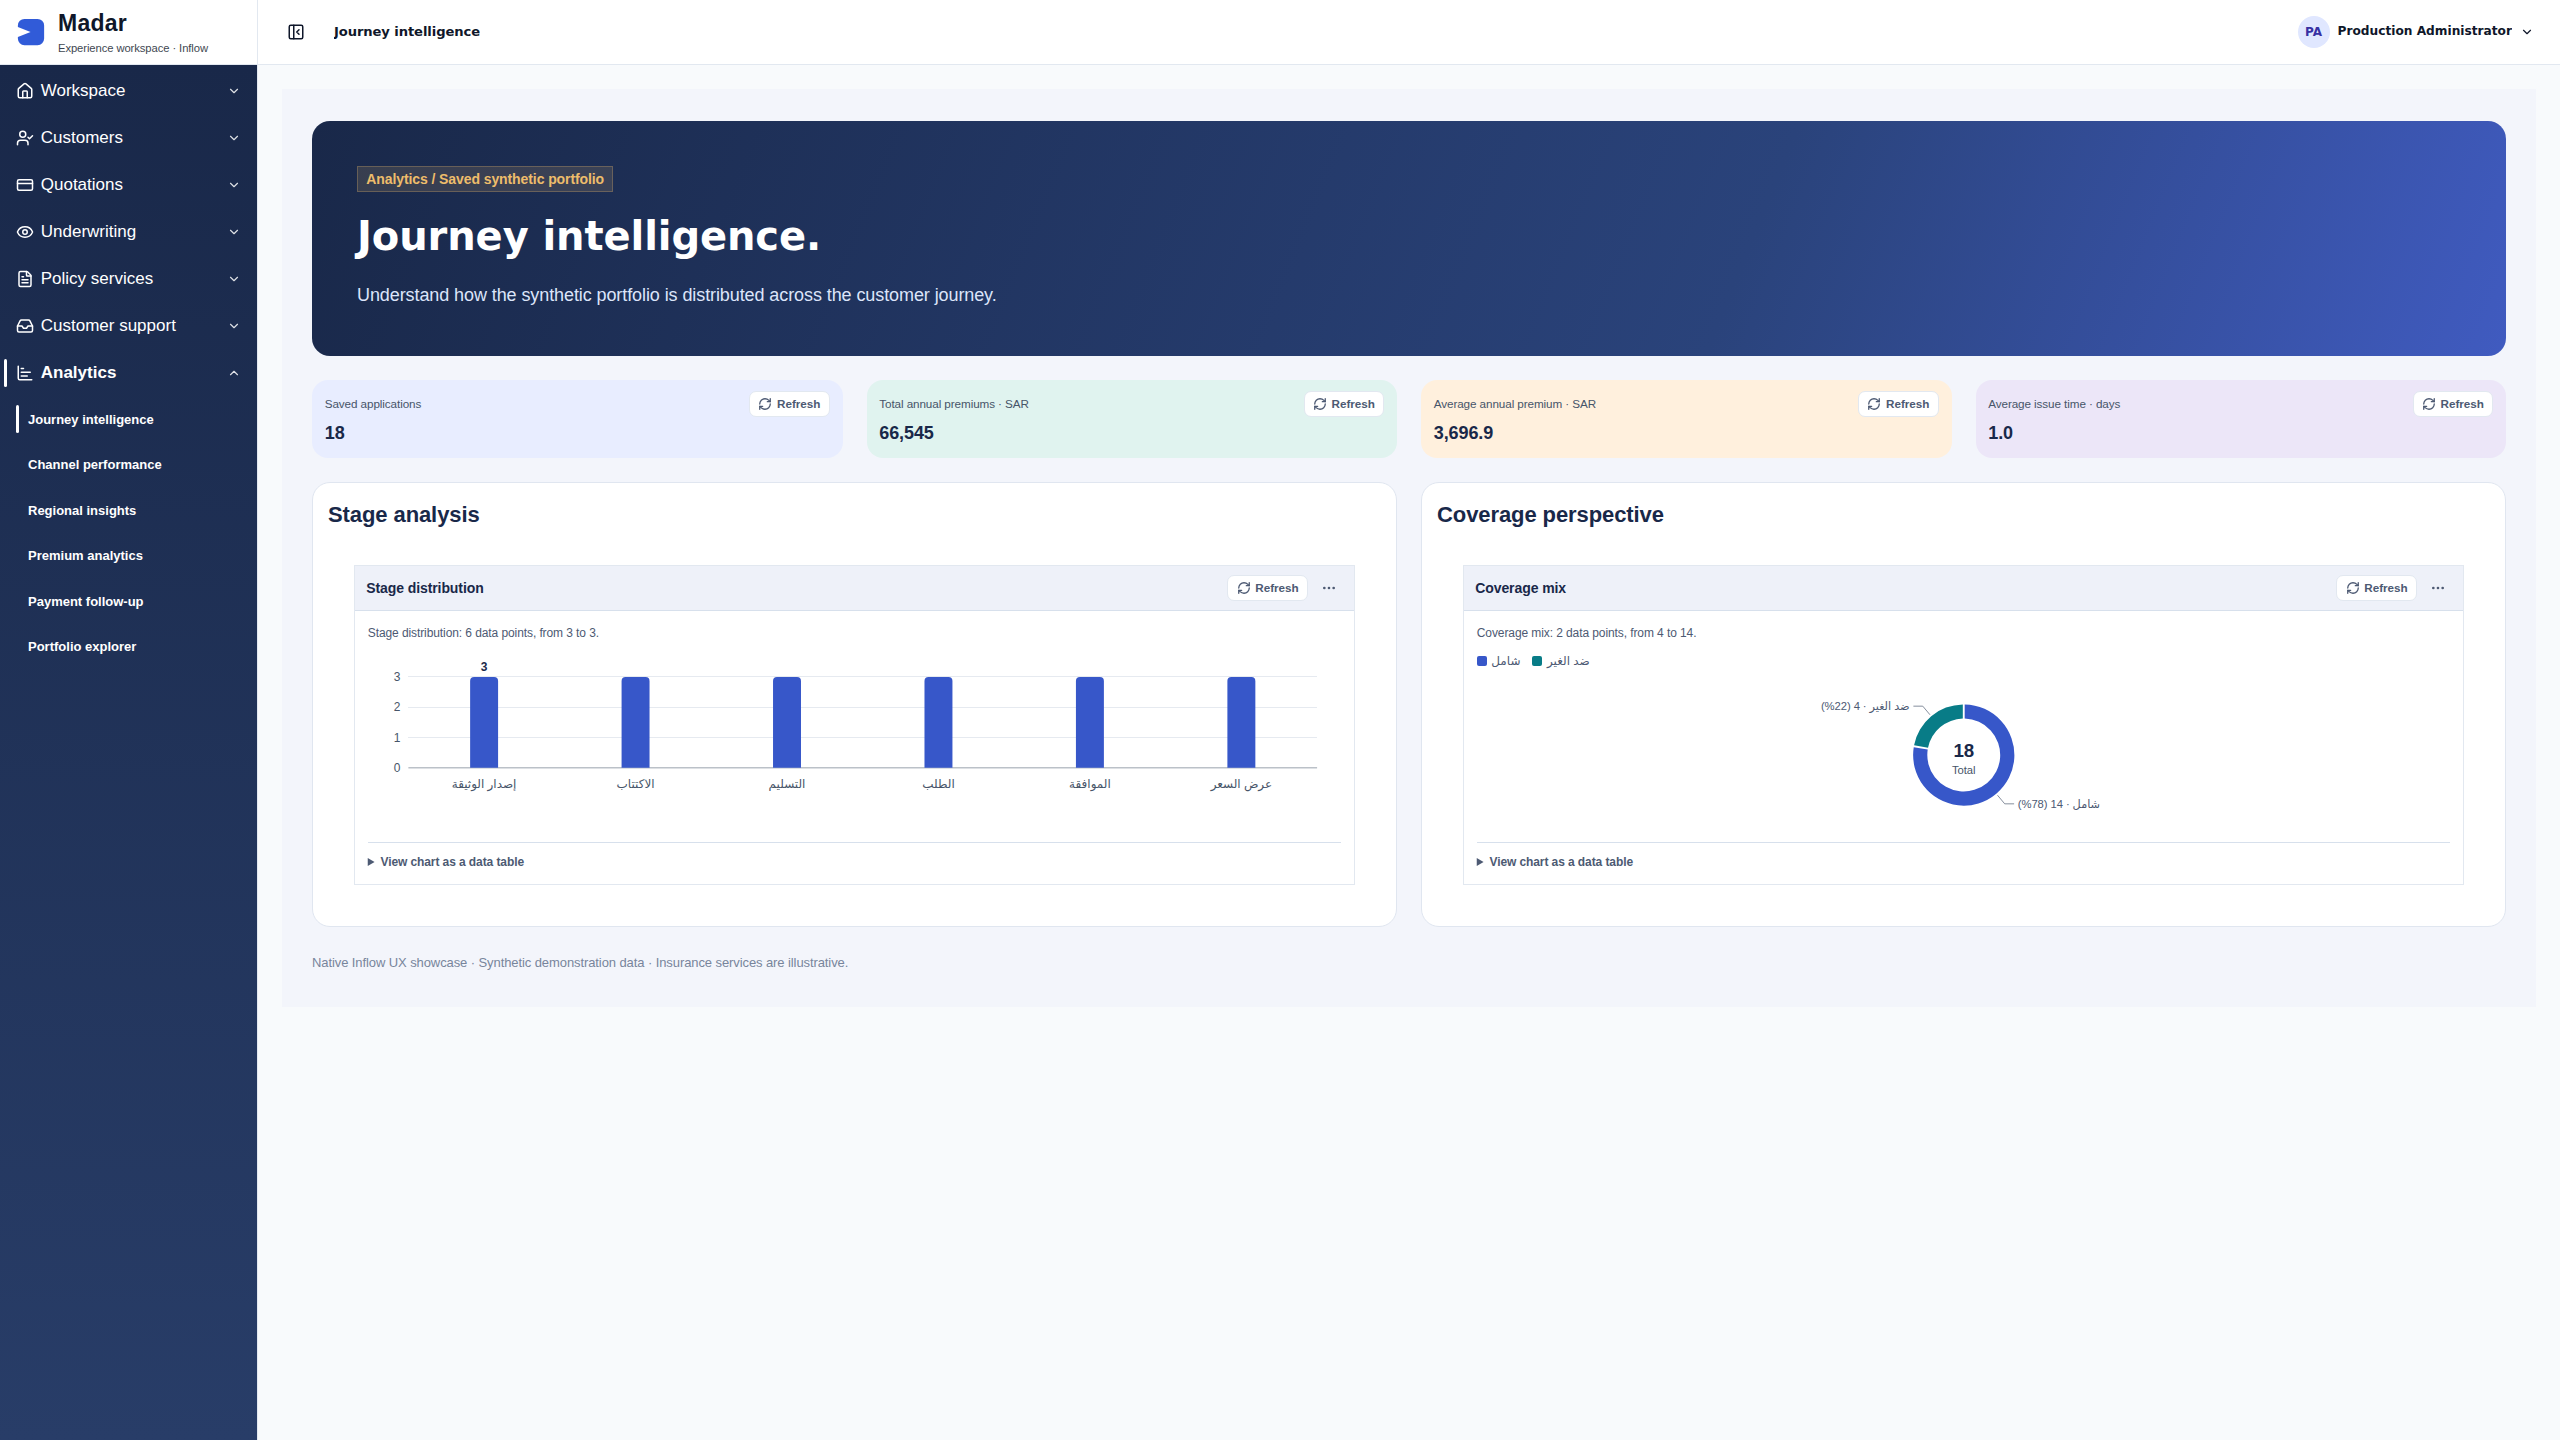
Present an overview of relevant business information. The retained procurement dashboard combines summary figures, a chart and a request table.
Make work needing review visible to responsible users. Retained examples show attention items alongside the request context.
A useful overview should connect to its business context. Review which records and definitions determine the displayed information.
Bring insight into the experience where people act. Coordinate report information with the tasks and next actions of the user’s role.
Explain the meaning of displayed measures and filters. Treat historical demo amounts and counts as sample content, not promised business improvements.
Discuss the objects, responsibilities and boundaries that make this capability useful in your environment.
The business definition behind each measure
The records, filters and reporting period in view
How teams move from an overview to the underlying work
Illustrative solution scenarios to shape a useful demonstration.
Show open procurement requests and the next deadlines needing attention.
Give a service team an overview of active requests and exceptions.
Review business outcomes using agreed definitions and relevant records.
Inside the product
Inspect native application and builder views, with full-size previews and the context behind each capture.
Native application reporting over saved synthetic records. Figures are demonstration data.
Native application reporting over saved synthetic records. Figures are demonstration data.
Native application reporting over saved synthetic records. Figures are demonstration data.
Native application reporting over saved synthetic records. Figures are demonstration data.
Native application reporting over saved synthetic records. Figures are demonstration data.
Native application reporting over saved synthetic records. Figures are demonstration data.
Native application reporting over saved synthetic records. Figures are demonstration data.
Bring your business journey, AI environment and integration needs. Let’s explore the right starting point.
Request a demo