See active work by state
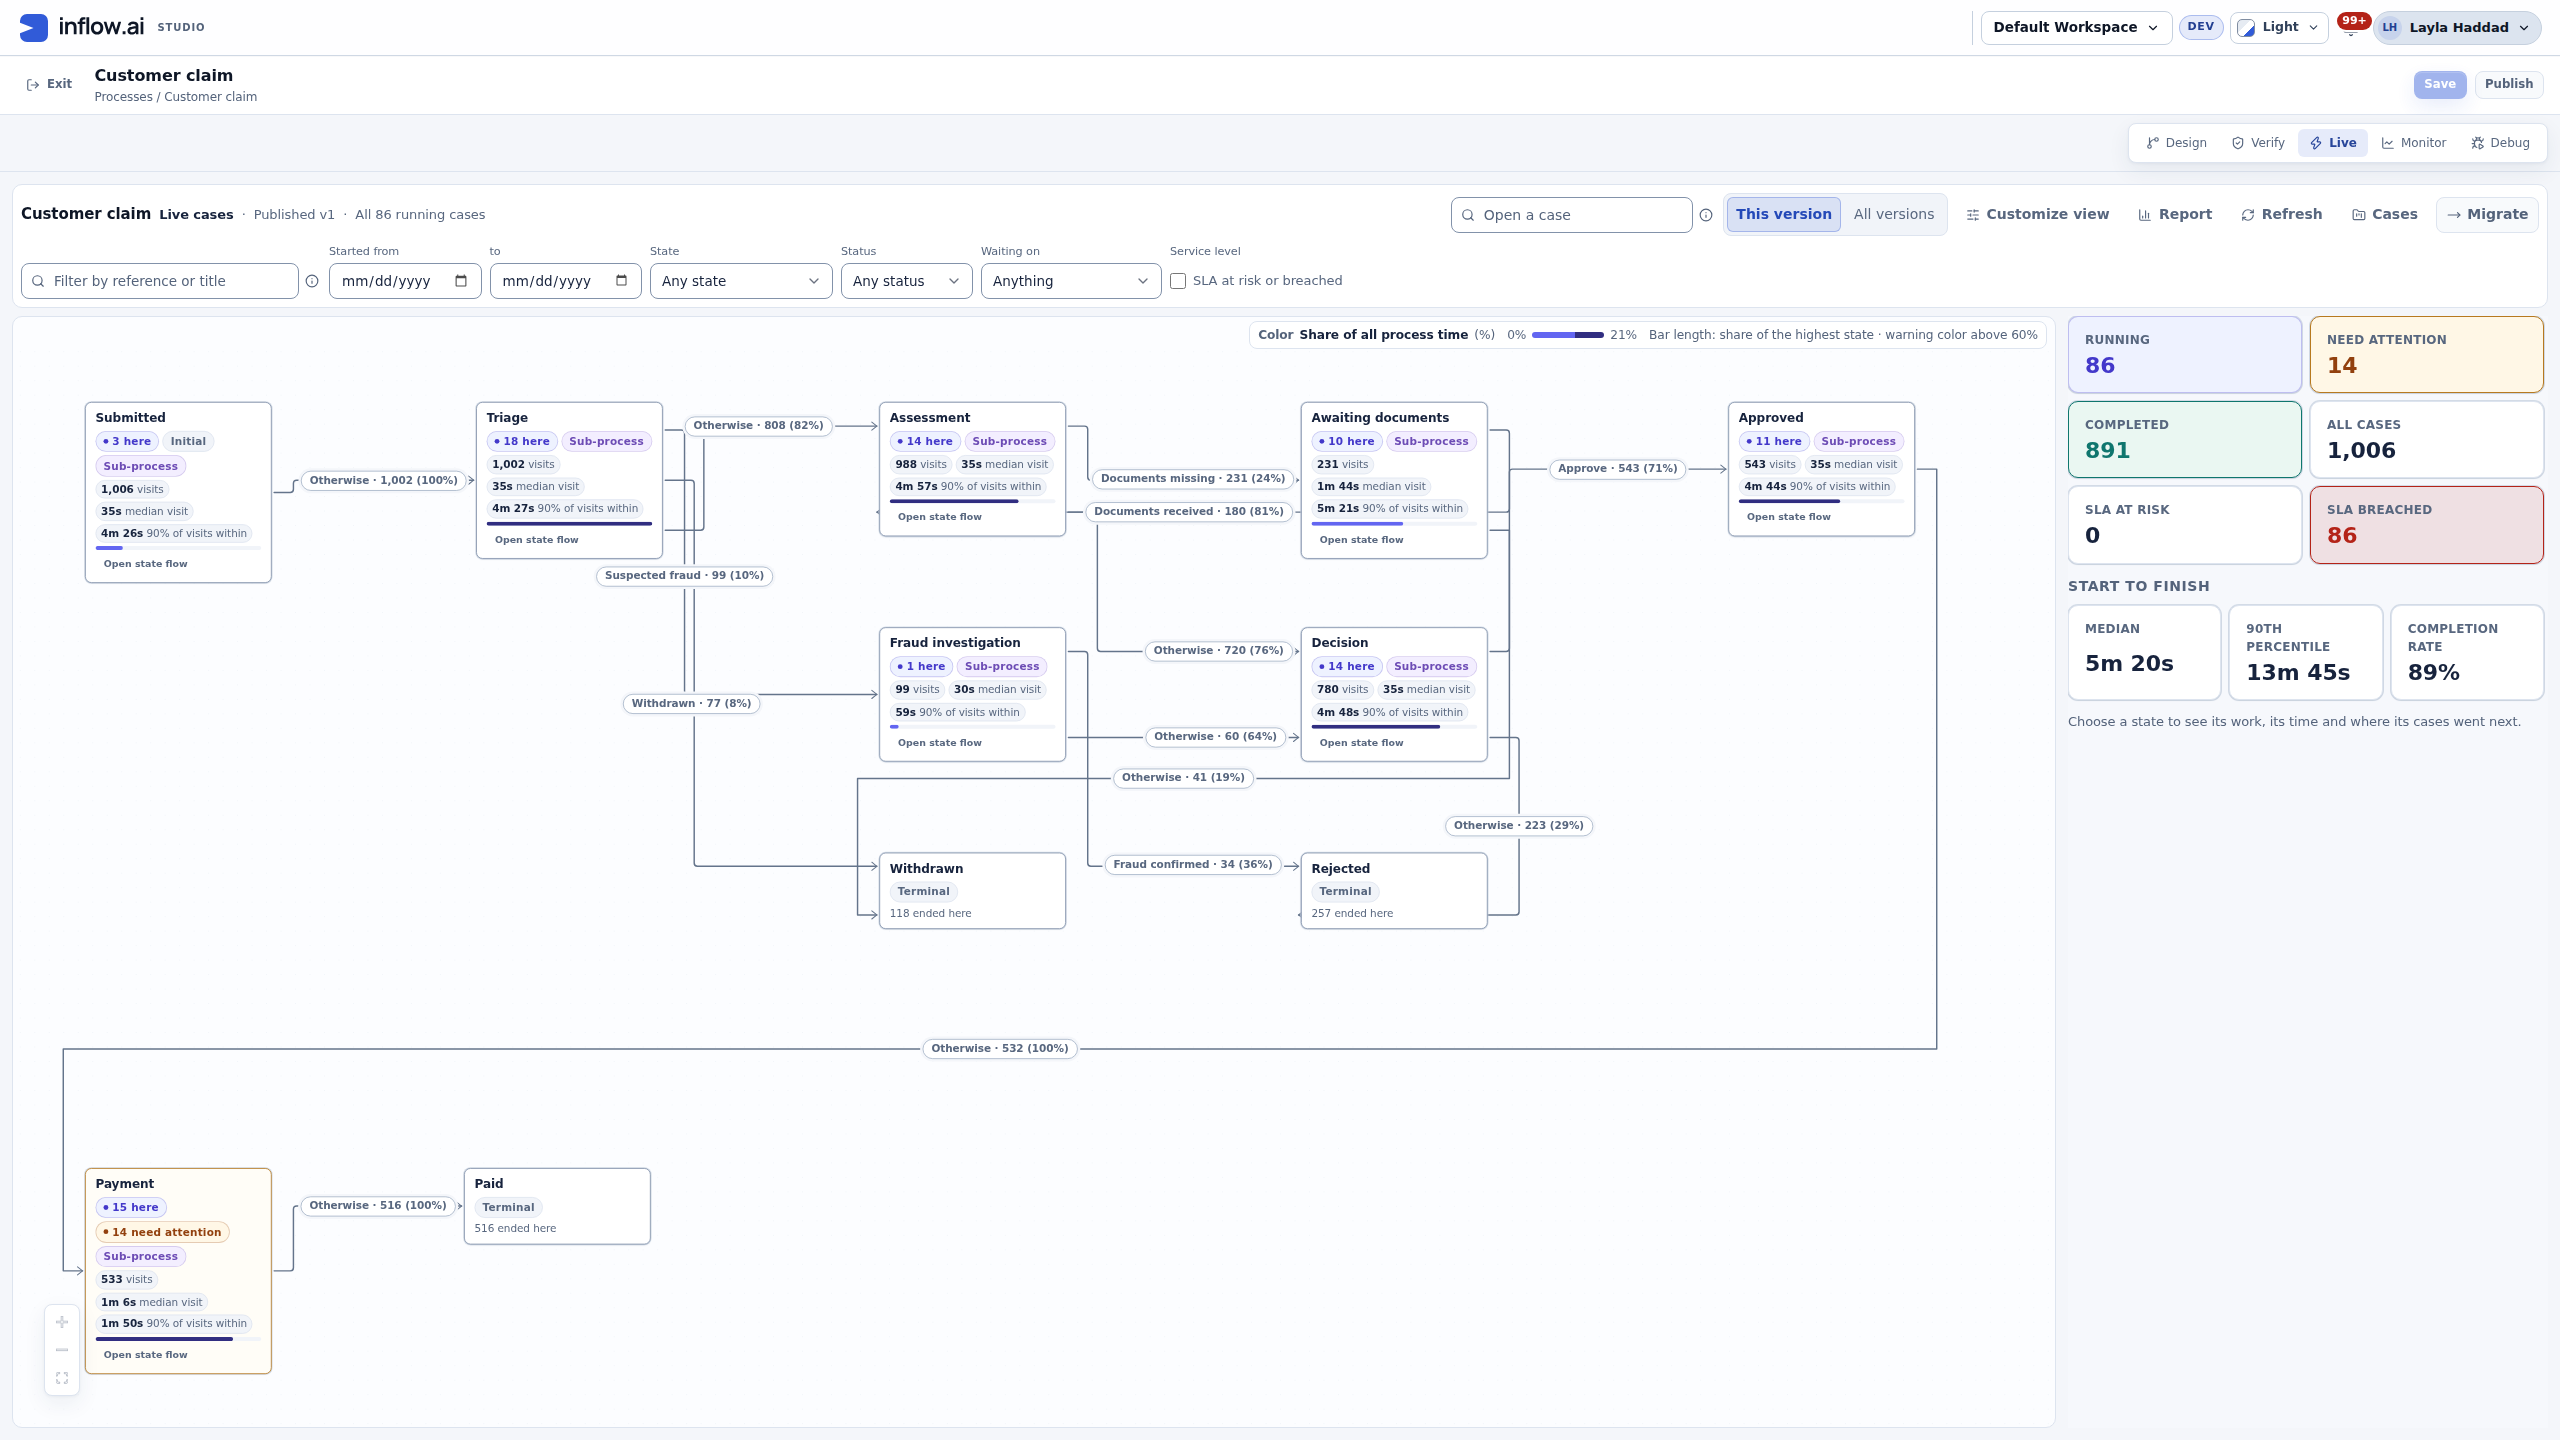
Inspect cases within the lifecycle context. The retained Live view shows active-case counts against state nodes.

Operate
Explore where cases are, what they are waiting on and which paths they have taken. Bring state context, case filters and operational history together so responsible teams can investigate the work.
Inside the product
Explore actual captured Inflow views. Change the view, open the original and read the context beside it.
Read the states, permitted routes and distribution of 1,006 fictional claims. Then follow the work inside a state or inspect one case.
Native development capture. Counts and timings belong to a synthetic demonstration, not a customer or performance benchmark.
Explore this capabilityInspect cases within the lifecycle context. The retained Live view shows active-case counts against state nodes.
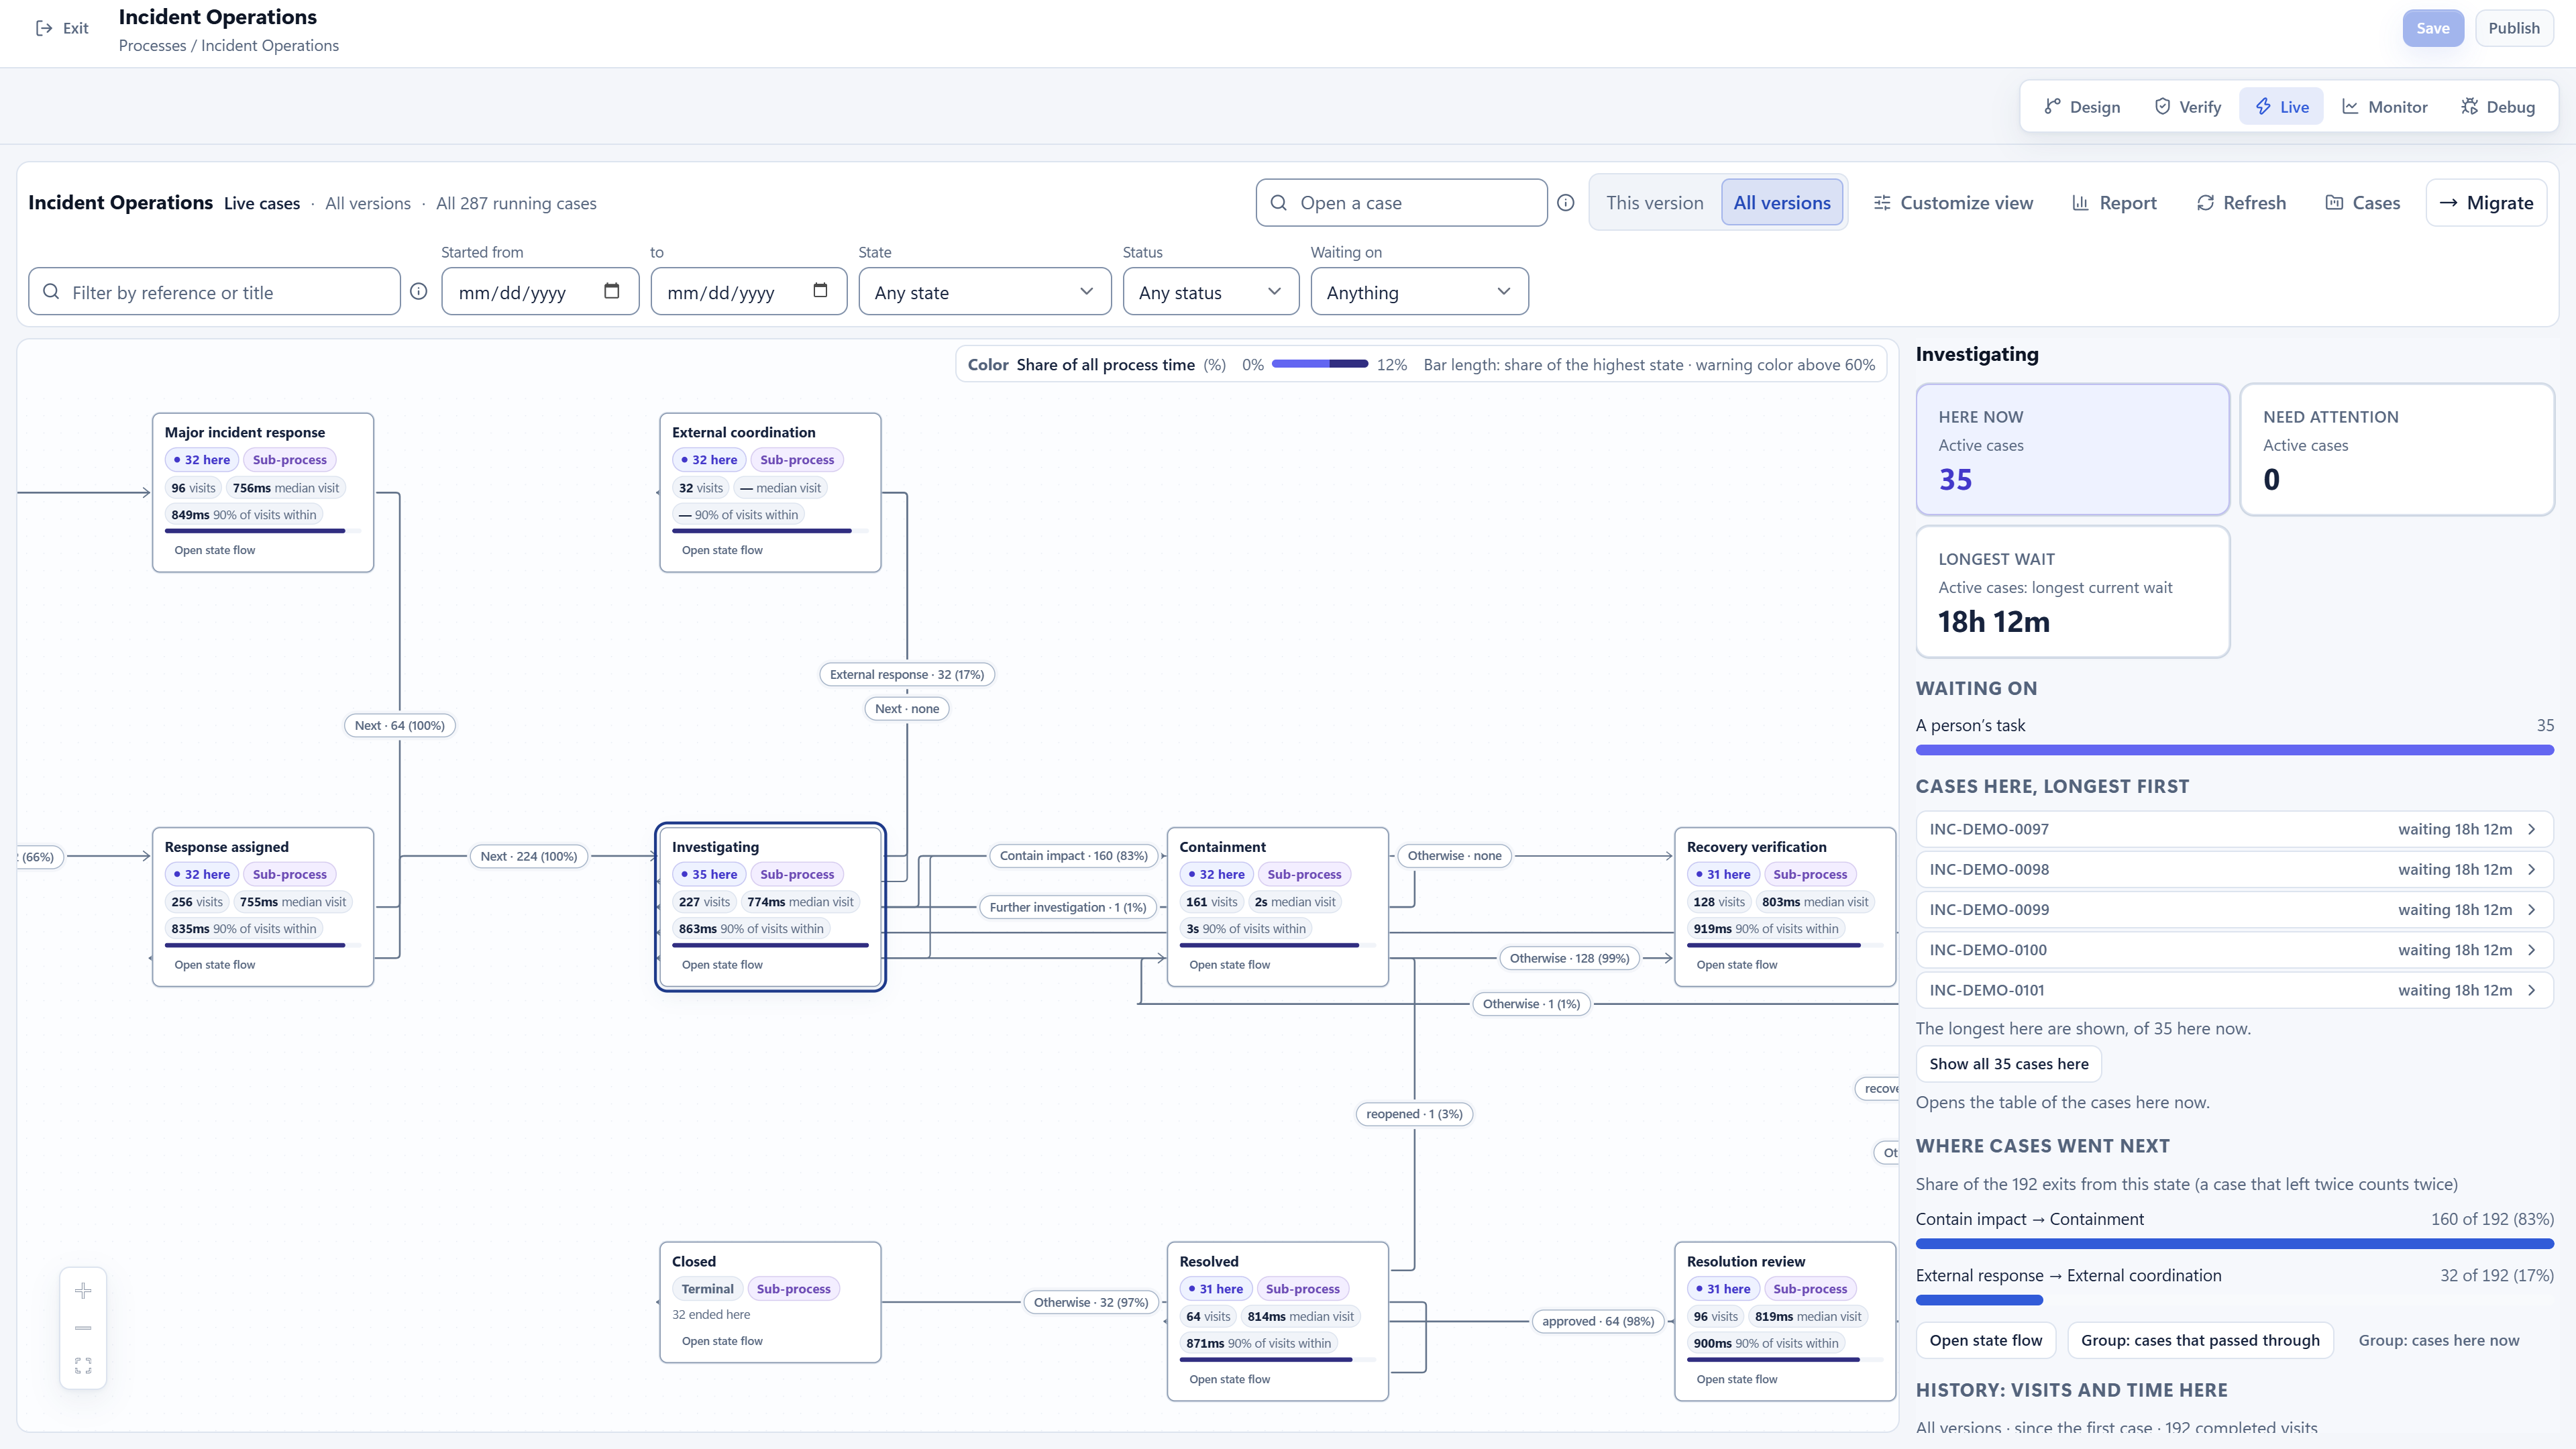
Show what is preventing progress at a selected state. The retained view distinguishes work waiting on a person’s task.
Read state visits and time information together, with the measure’s definition and the selected case/version scope visible.
Understand where cases went after a state. The retained view shows destination routes and their associated demonstration counts.
Narrow the operating view to useful business context. Retained controls include reference/title, dates, state, status, waiting reason and current/all-version selections.
An overview is useful when people can investigate the underlying work. The retained view includes case lists, open-state-flow and report entry points.
01 / A closer look
Start with the lifecycle rather than a disconnected list. State-level case views help the team understand where work is concentrated and which cases need a closer look. A selected state connects the overview to its operational context.
02 / A closer look
A count shows where to investigate; a case path explains what happened. Inspect the selected case across its visited states, timeline and time view, keeping its reference consistent throughout.
03 / A closer look
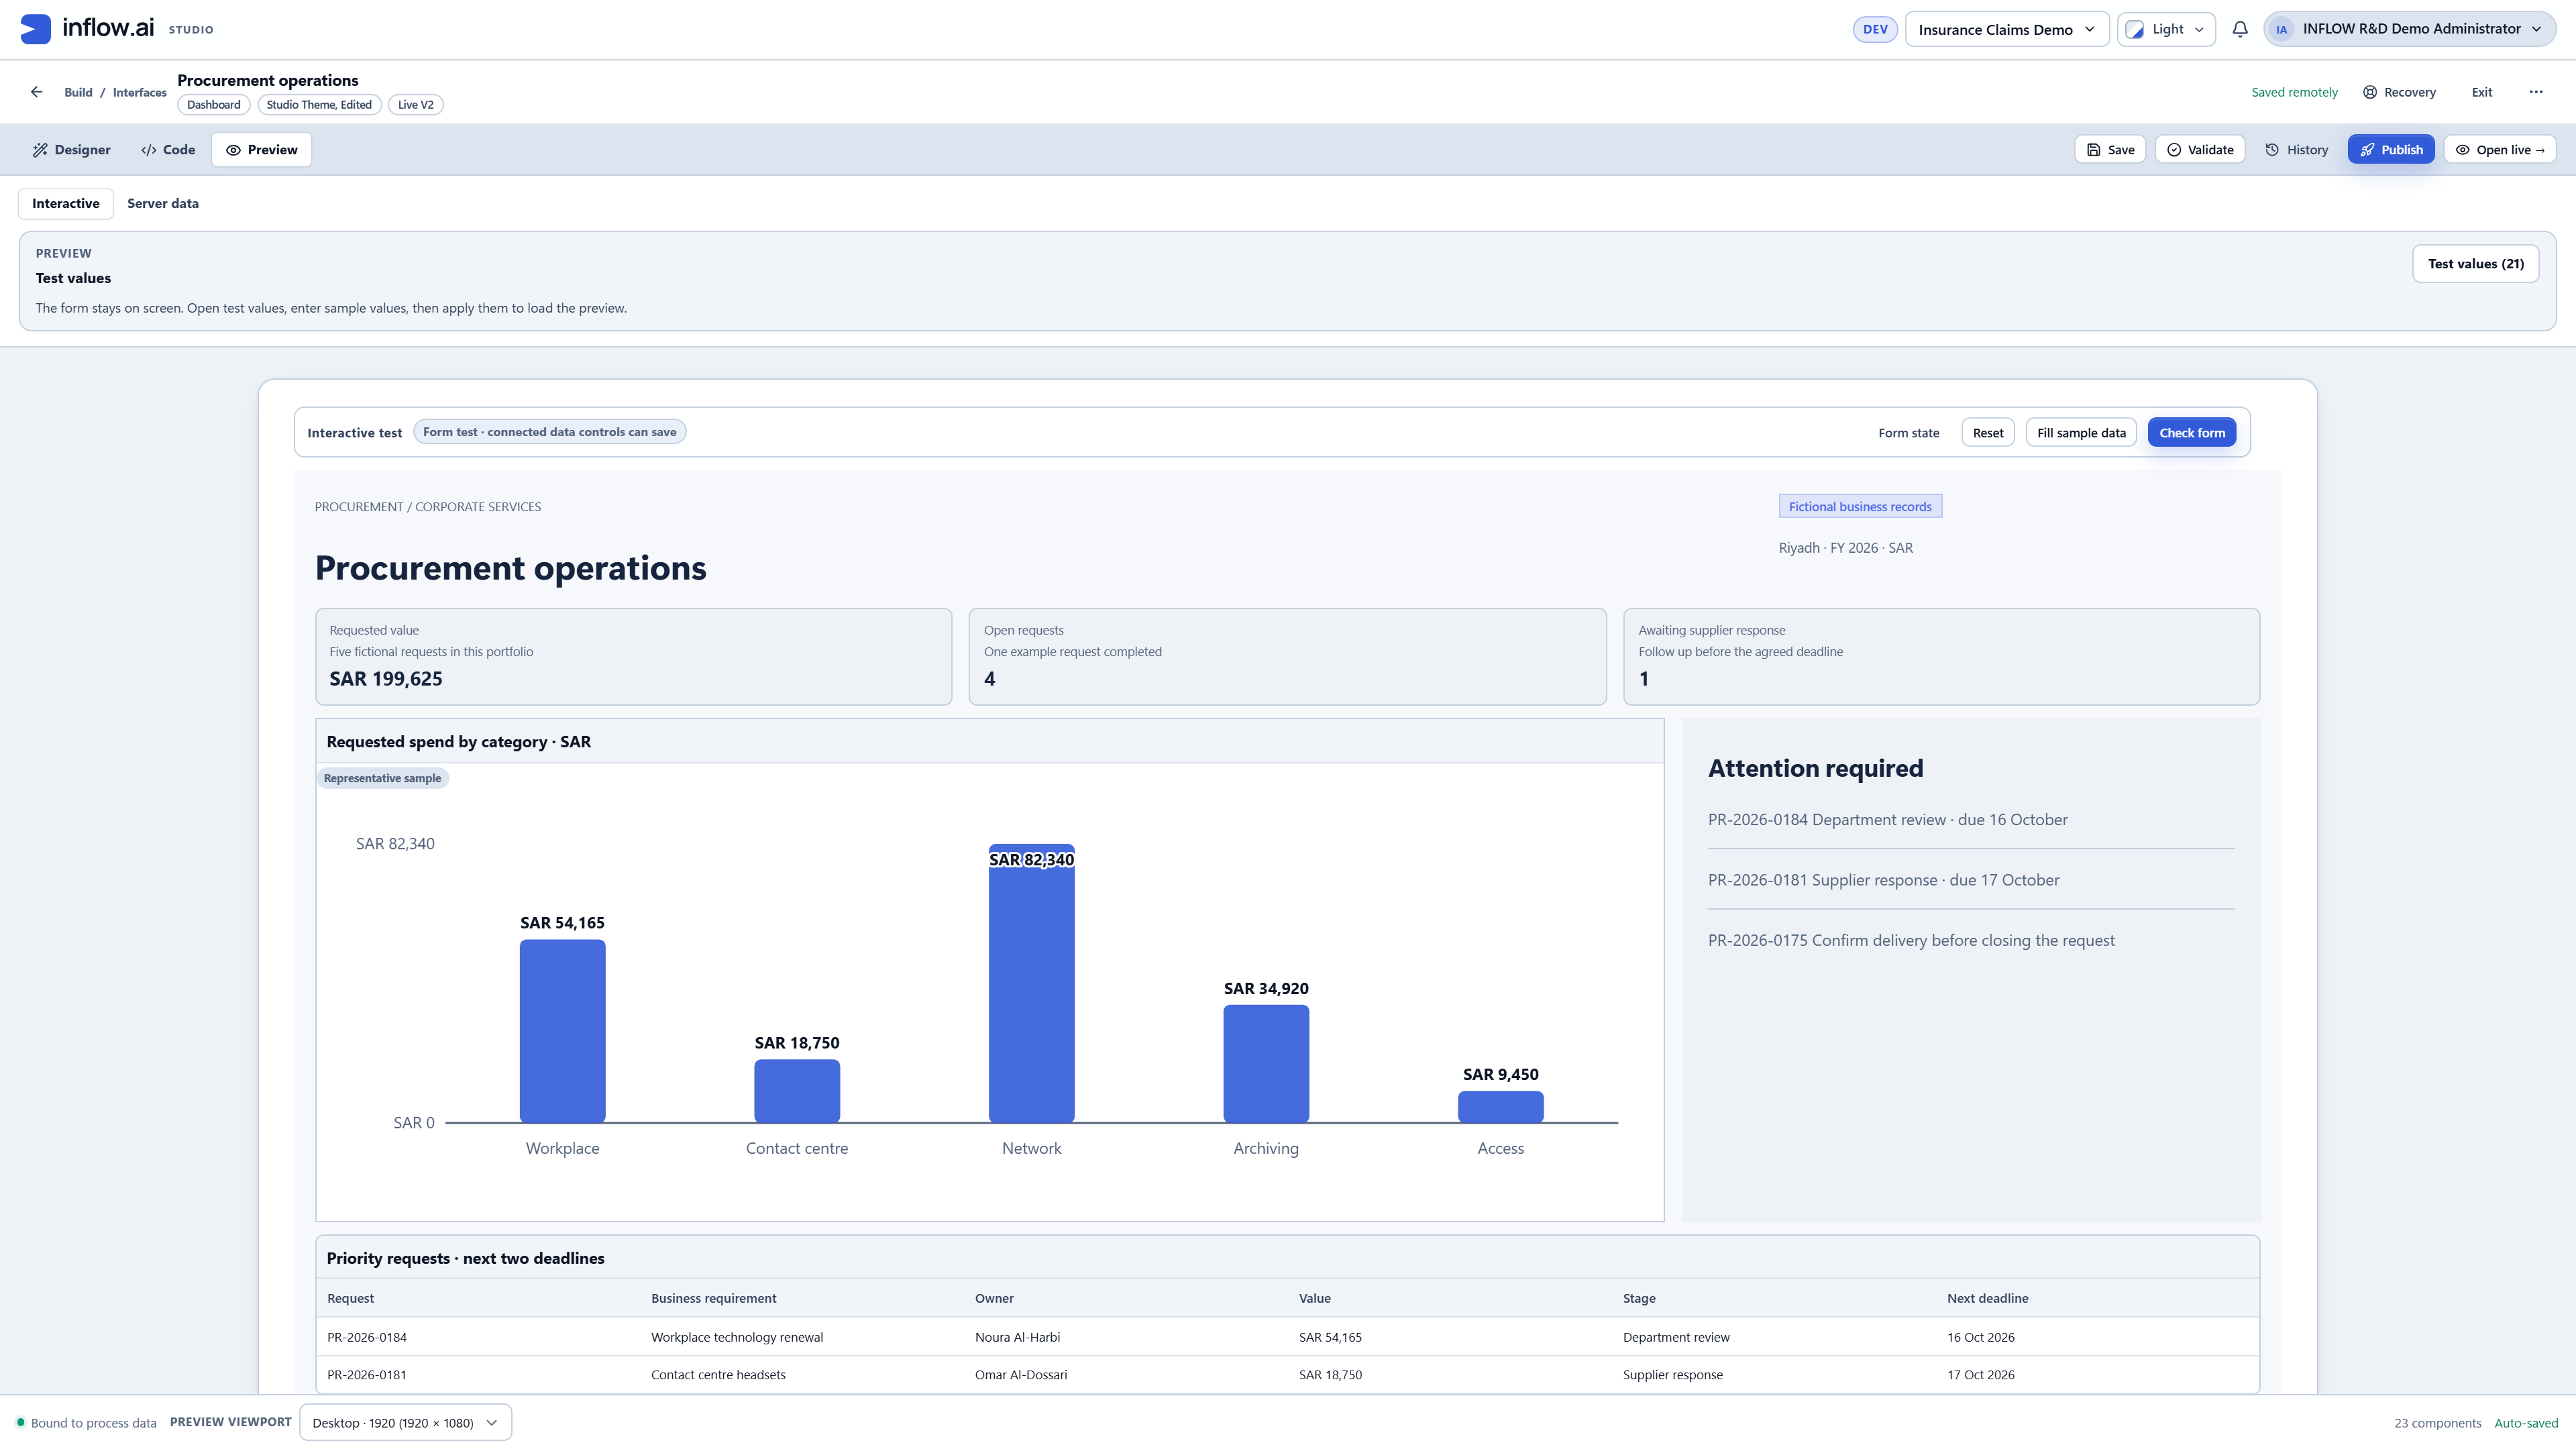
An application dashboard presents a different view of the same business domain. Combine charts and record context with a question that helps someone decide what to examine next. The Claims Desk example shows how a conversation can stay anchored to a specific record.
Discuss the objects, responsibilities and boundaries that make this capability useful in your environment.
The case population and model versions in view
The meaning of each time, count and waiting indicator
The responsibility and next action behind an exception
Illustrative solution scenarios to shape a useful demonstration.
Find incident cases waiting at an investigation state.
Review which service cases need a person’s follow-up.
Inspect the destinations taken after a configured review stage.
Genuine retained demonstrations, shown with their original context. Open each view to inspect the details.
Bring your business journey, AI environment and integration needs. Let’s explore the right starting point.
Request a demo